Screen 2 — Real-Time Activity, Power Grid Generation Status
Summary
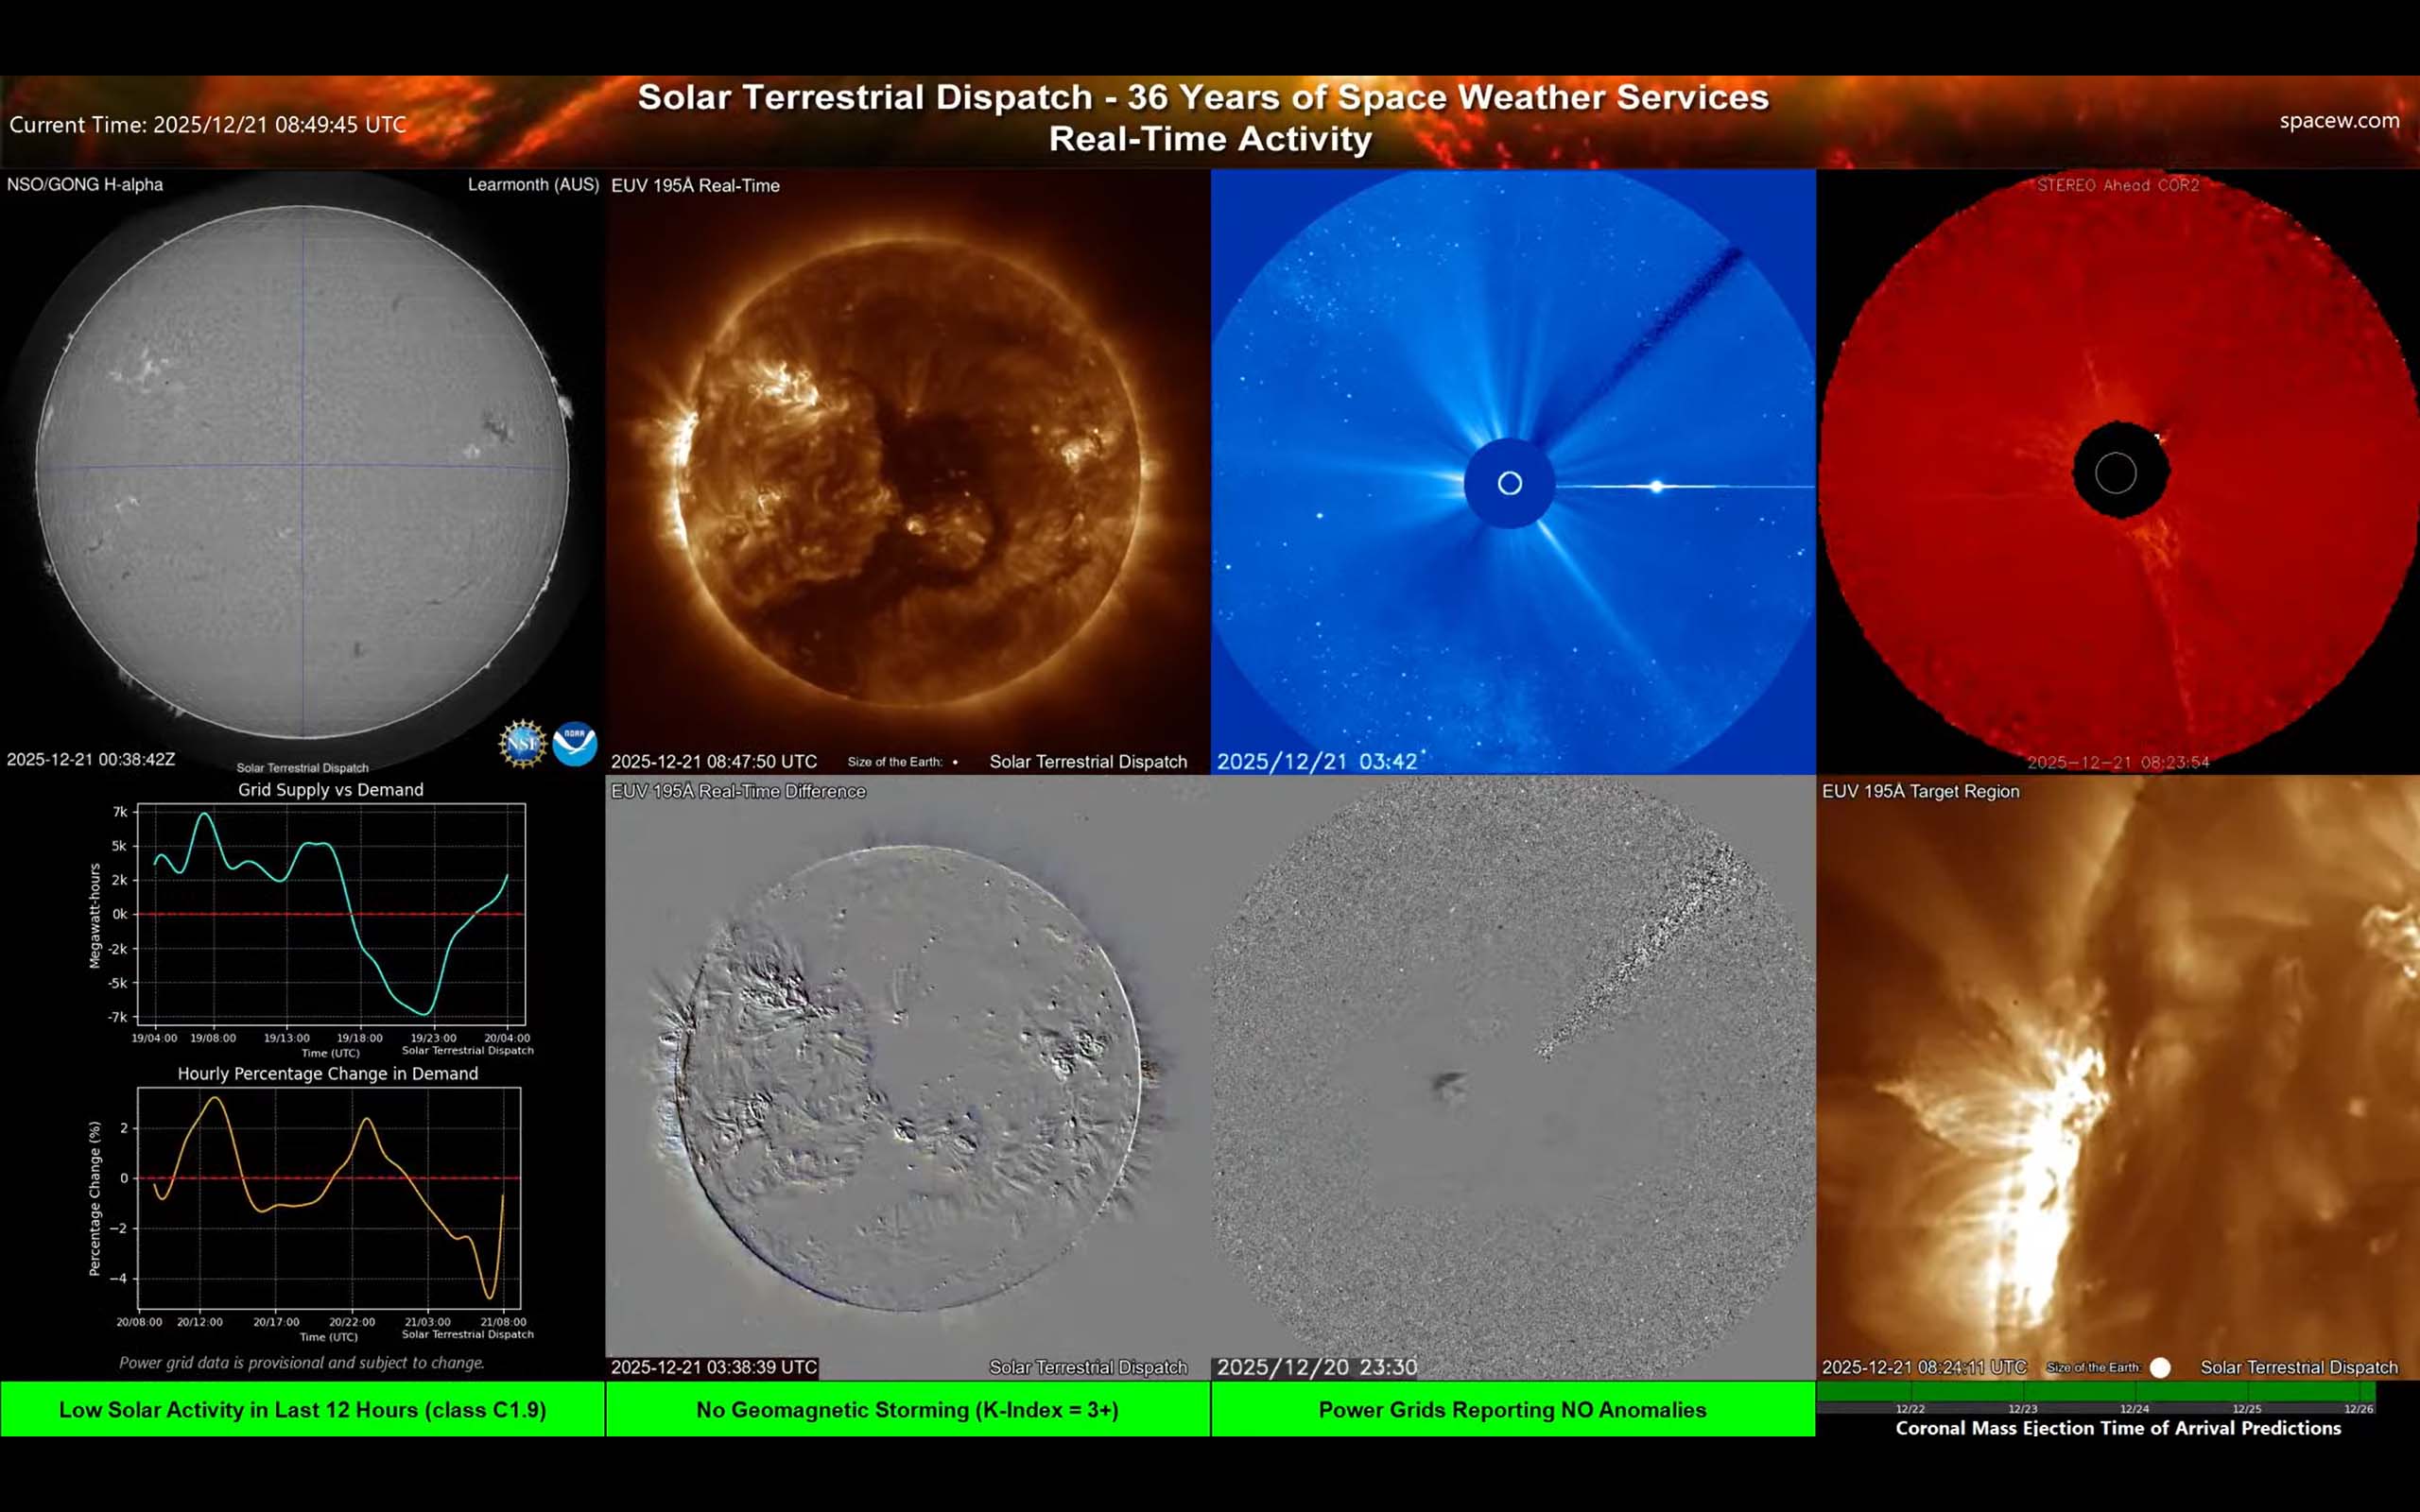
This screen is the same as Screen 1, except that it shows the status of electricity generation by the power grids of the United States (lower-left), and a focused view of active solar regions (lower-right).
More detail
What you’re looking at
- Power-Grid Generation Status: The power requirements (electricity generation and demand) are shown in the bottom-left plot. Negative values represent periods of time when electricity into the United States is imported (insufficient generation to support demand). Demand is shown as a percentage of change, with positive values meaning there is more demand for electricity than the average demand.
- Target/zoom region: A close-up of the most interesting active region at the moment.
How to use it
- Look for rapid brightening in EUV or in the difference image — that often means a flare or heating event is happening.
- Look for dark ‘dimming’ areas that appear after a bright event — sometimes a clue that material left the corona.
- Check coronagraphs for an expanding cloud (a CME). A CME is important because it can later affect Earth’s magnetic environment.
- Periods of stress on the power grids can be seen when there is strong demand (above normal, yellow) and when generation capacity (cyan) is negative.
Practical tip: This screen is best for answering: “Did anything erupt?” and "How are the power grids fairing?", not “Will I see aurora tonight?” For aurora potential, you generally also want near-Earth solar wind and magnetic field panels (see Screens 3, E and F).