Screen 7 — Short-Term Flare Likelihood (Surya overlay) + Shear Intensity
Summary
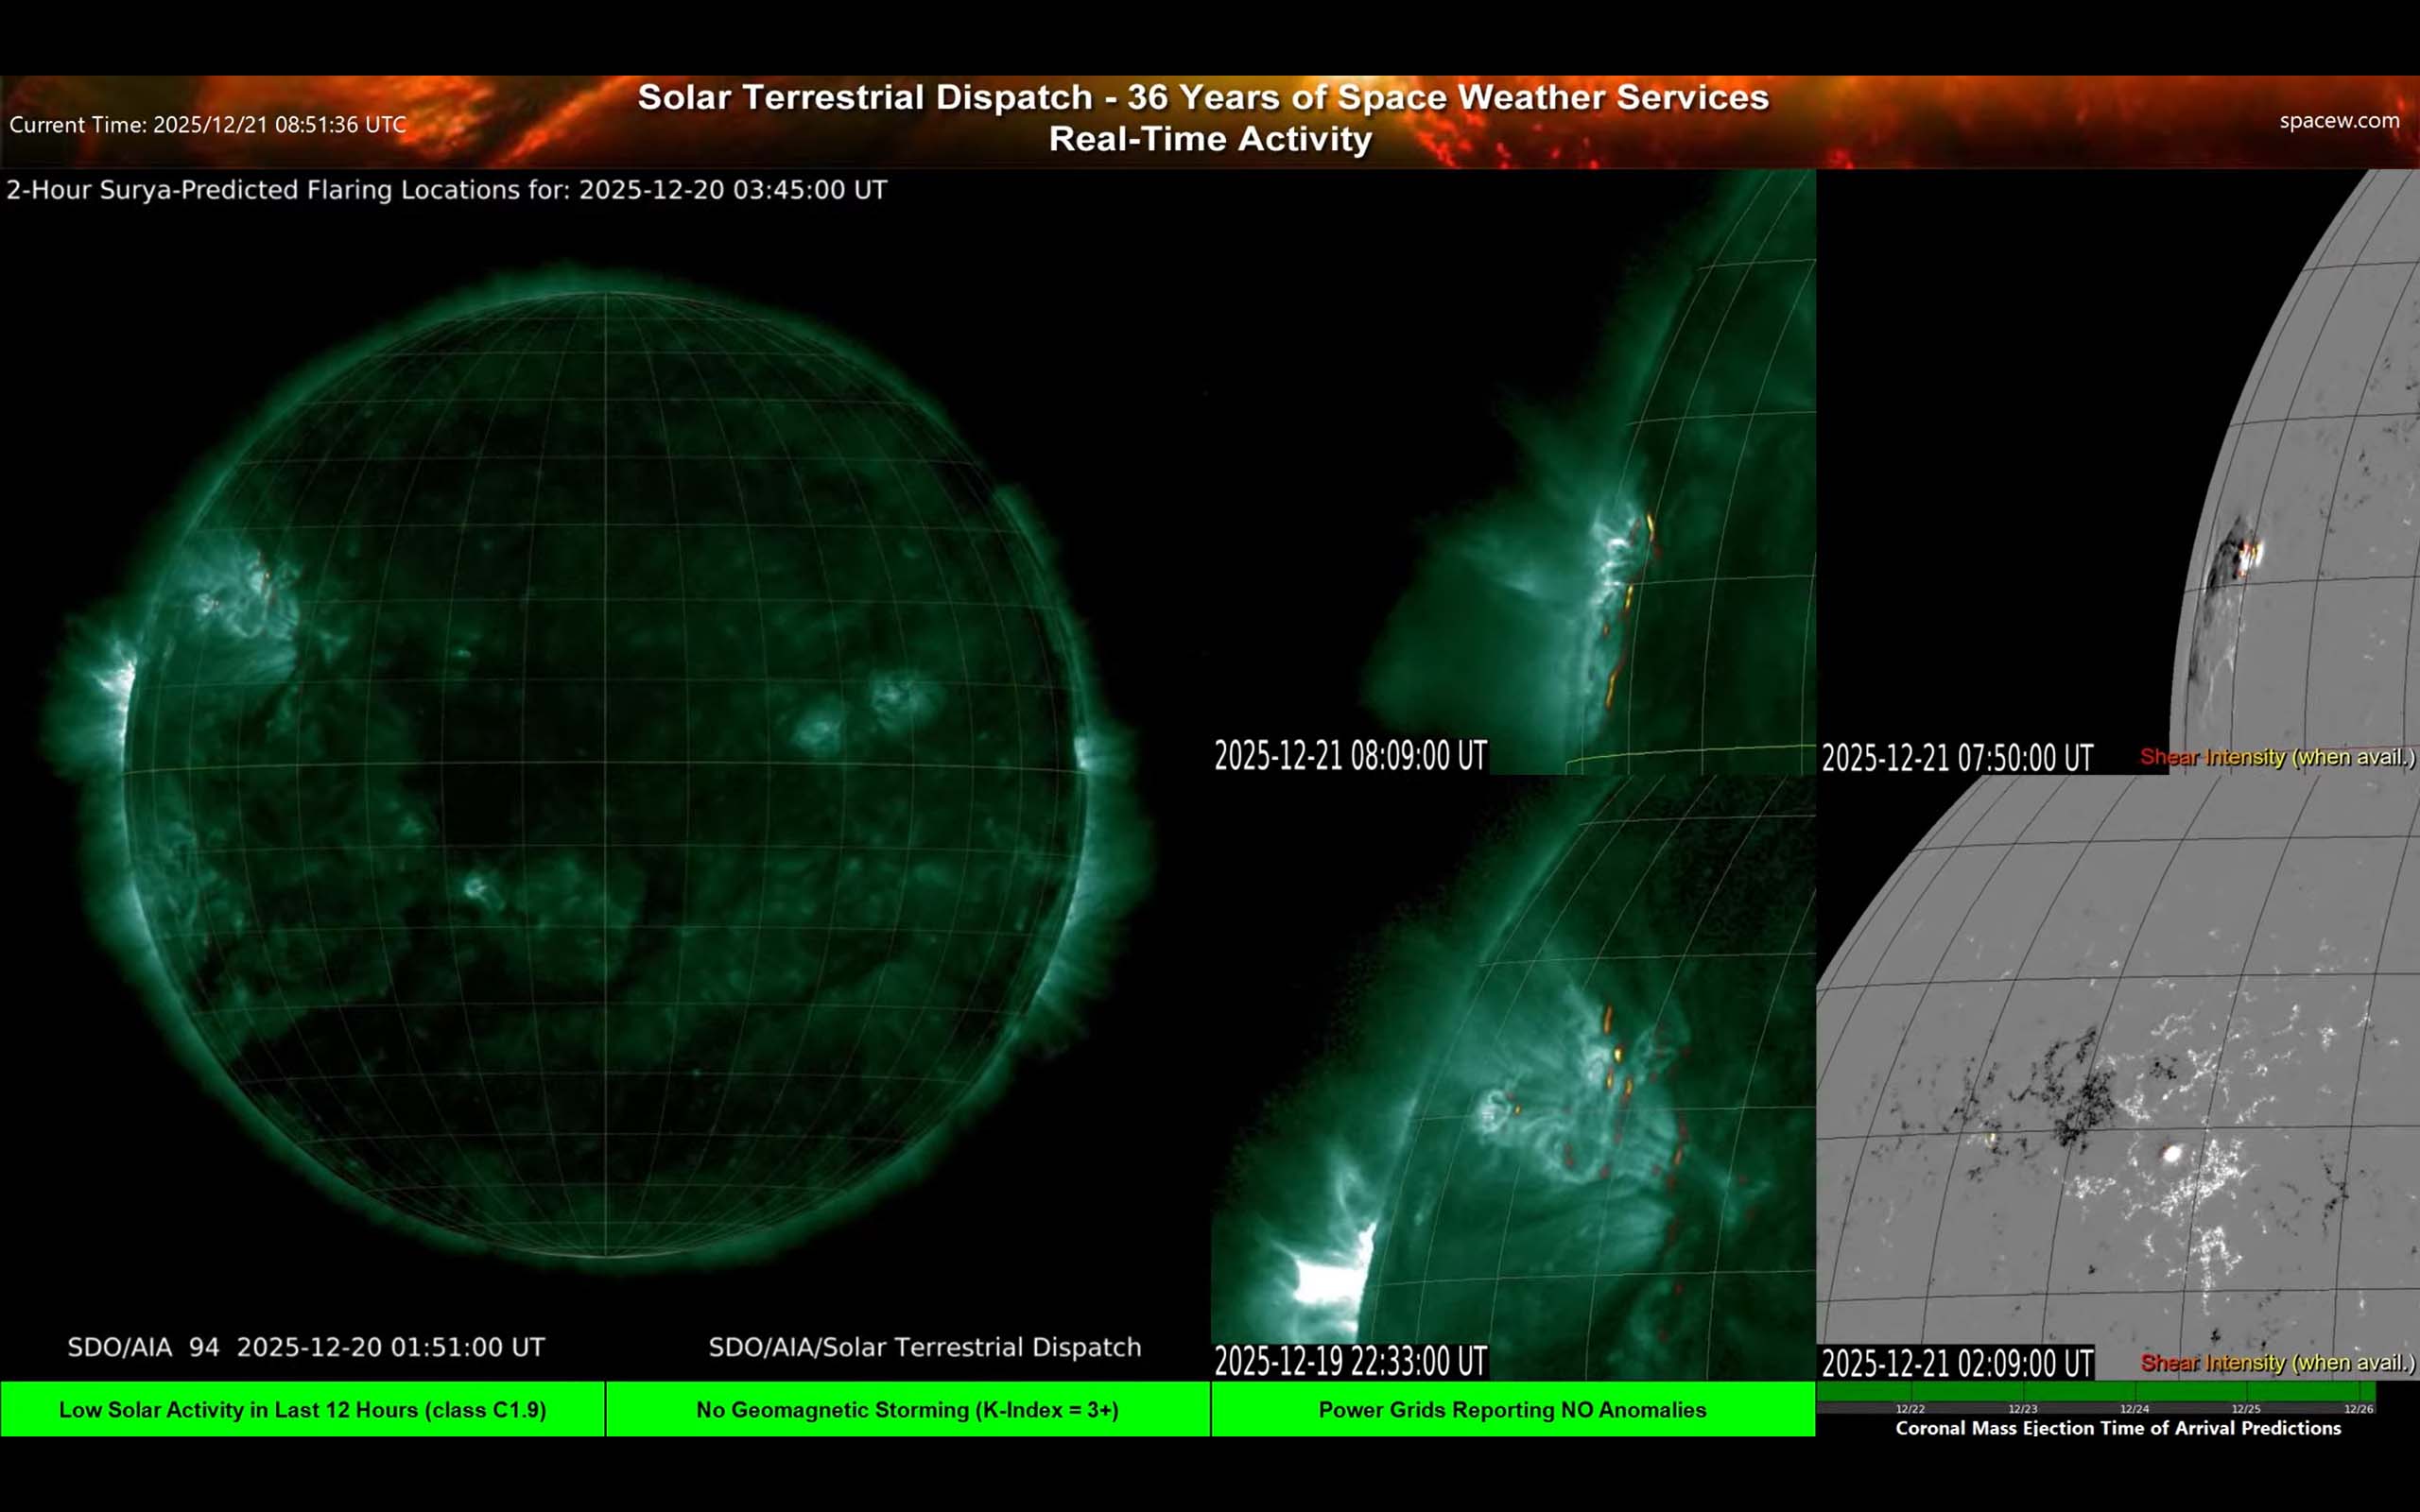
This screen adds a short-term ‘where to watch’ forecast overlay. It highlights areas the model thinks are more likely to flare soon, and pairs that with a shear-intensity diagnostic (a measure of magnetic stress). The Surya model is NASA's new AI-driven heliospheric foundation model, developed in cooperation with IBM, which is being run at Solar Terrestrial Dispatch.
More detail
What you’re looking at
- AIA 94Å (hot corona): Often emphasizes very hot plasma associated with flare-capable regions.
- Prediction markers/overlay: Indicates probability hot-spots — places to pay attention to over the next couple of hours.
- Shear intensity (when available): A “magnetic stress” indicator. Higher shear can mean more stored energy and greater flare potential.
How to interpret it
- This is not a guarantee that a flare will happen. Treat it as: “watch these areas more closely.”
- Use it together with live imagery: if a predicted region also shows rapid brightening or restructuring, confidence increases.
- Shear is a risk clue: think “twisted rubber bands” — more twist can mean a bigger snap, but it doesn’t tell you exactly when.
Practical tip: If you’re new, use this screen to develop intuition: compare the overlay with what actually happens over the next hour or two. This practice can teach you faster than memorizing terminology.