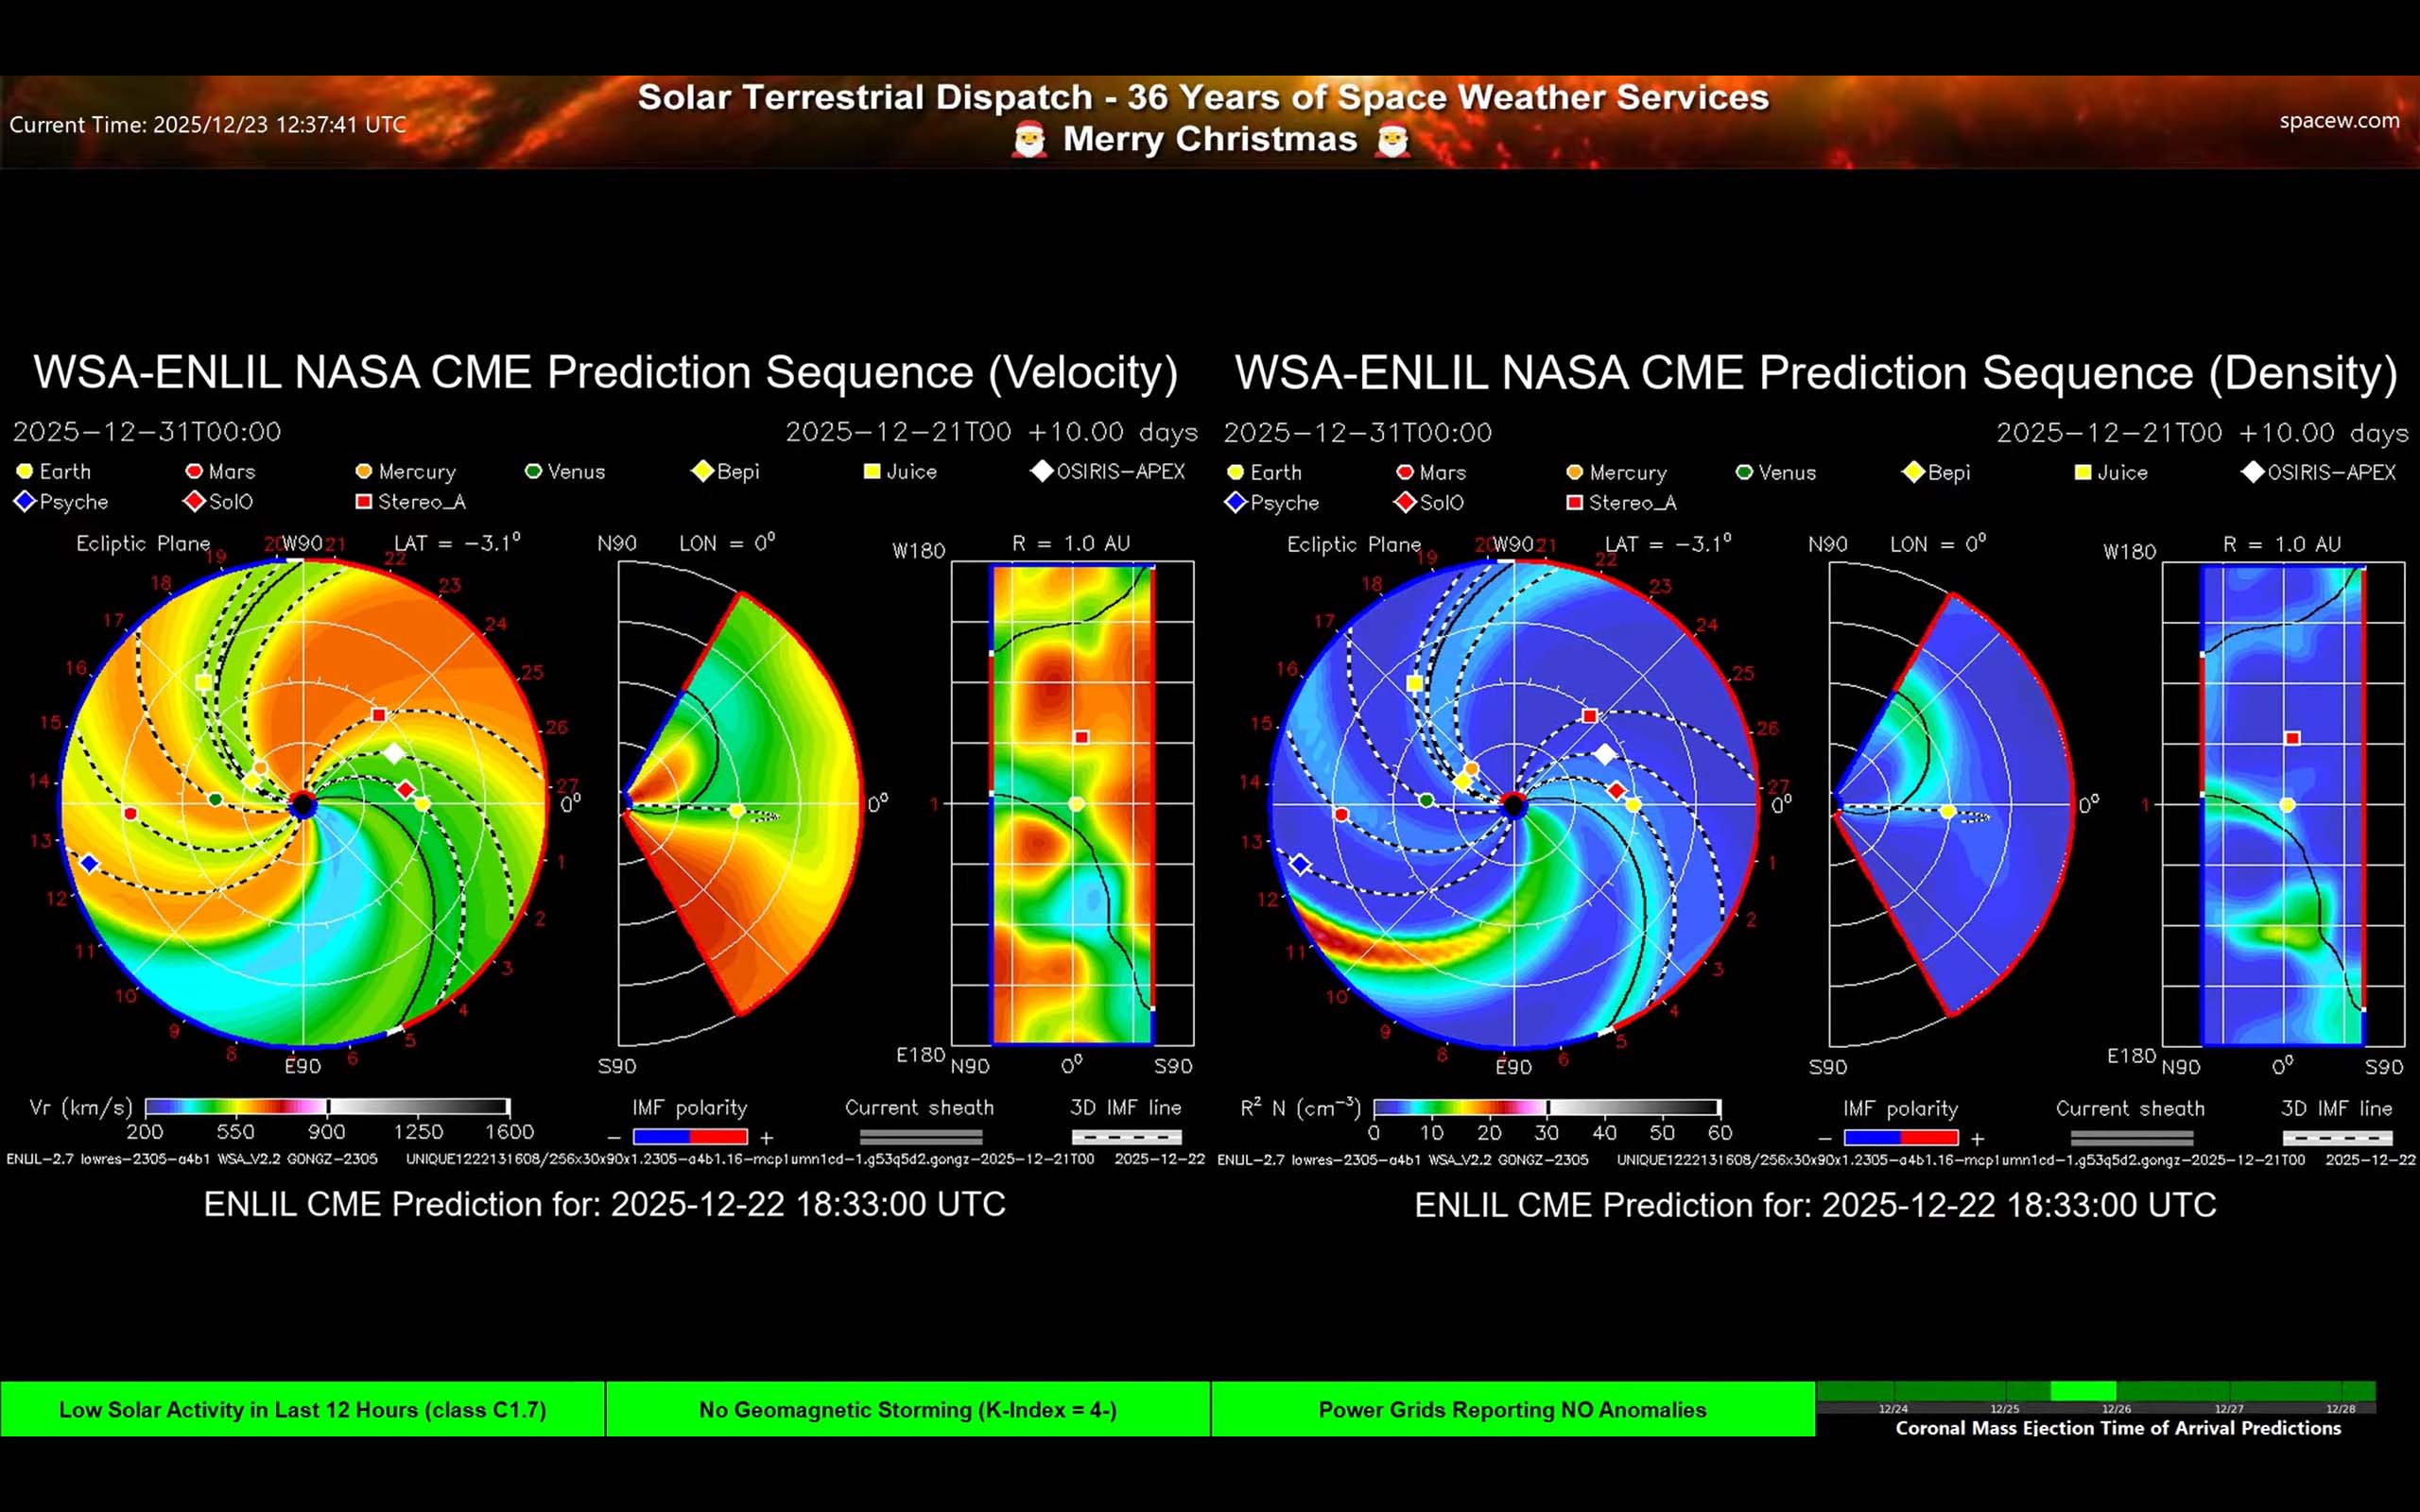
Screen G — WSA-ENLIL CME Forecast (Solar wind speed + density)
Summary
This is a computer forecast that simulates how a coronal mass ejection (CME)—a big cloud of solar plasma—may travel through the solar system over the next several days. The left panel highlights changes in solar-wind speed, and the right panel highlights how “thick” (dense) the plasma is. If a fast, dense cloud sweeps over Earth’s marker, Earth could experience geomagnetic disturbances and stronger aurora chances.
More detail
What you’re looking at
- Two panels: Velocity (left) shows how fast the solar wind is moving. Density (right) shows how much material is in the solar wind.
- Sun at the center: Everything expands outward from the middle of each big circle.
- Planet and Spacecraft markers: Small symbols label where Earth, Mars, etc., and other spacecraft are located in the solar system at the time of the prediction. If a “cloud” reaches Earth’s symbol (a yellow circle on the right side of each image), that’s the model’s predicted arrival at Earth.
- Time window: The timestamps at the top indicate the model run time and how far into the future the sequence extends (often about 10 days).
How to read the colors
- Speed (left): Cooler colors = slower solar wind. Warmer colors = faster solar wind. An average solar wind blows at about 380 to 400 kilometers per second. Fast speeds from coronal holes can reach 800 km/sec. Extremely fast coronal mass ejections can exceed 1,500 km/sec.
- Density (right): Cooler colors = thinner/less material. Warmer colors = thicker/more material. Thicker and/or faster material applies more pressure against the Earth's magnetic field, which can increase the chances for geomagnetic and auroral storming where the Earth's magnetic field shakes more than normal.
- A CME in the model: Usually appears as a distinct moving “bulge/arc” of faster wind and/or higher density spreading outward from the Sun. It is often highlighted by a white encircling line.
What the smaller side views mean
- Wedge / side slice: A cut-through view that helps show whether the CME is aimed near the plane where the planets orbit (the “flat” plane of the solar system). Regions above the Earth's circle are north of the Earth.
- Tall narrow map (right): A summary of conditions across different directions at the Earth’s distance from the Sun (useful for seeing whether the disturbance is wide or narrow) and how close particular solar wind streams are to the Earth.
For more advanced users
- These predictions include information about the Sun's magnetic field that stretches out in a spiral shape with the solar wind.
- An outer ring of red or blue colors indicates whether the solar wind magnetic field is pointing inward (blue) toward the sun, or outward (red) away from the sun.
- When a CME plows through the solar wind, the magnetic field lines get draped around the CME. Knowing the direction of the magnetic fields (inward or outward) upstream of that draping can be useful to help predict whether the Earth sees, for example, strong southward (negative Bz) conditions when the CME impacts, which can increase geomagnetic and auroral storm activity.
- Solid black lines define the locations where these magnetic fields suddenly flip from inward to outward (or outward to inward). These regions are inside the heliospheric current sheet and can have effects at the Earth, particularly if a CME gets entangled with it.
- The dotted black and white lines identify what areas of the Sun are magnetically connected to the planets or spacecraft. Energetic particles (i.e. protons) flow most easily along these field lines, so knowing where they connect to the Sun can help determine the risk of energetic particles enhancing the radiation environment in space around the Earth. This is critical information for keeping astronauts safe, for example.
So… what should a we look for?
- Step 1: Find Earth’s marker in the yellow circle.
- Step 2: Watch whether a fast (warm colors) and/or dense (warm colors) “cloud” reaches that point during the forecast.
- If it hits: Increased chance of geomagnetic activity (auroras and maybe technology impacts) around the predicted arrival time.
- If it misses: Little to no CME impact expected for Earth (other planets or spacecraft may still be affected).
Important limitation: This is a simulation, not a guarantee. CME arrival time and strength can be off (sometimes by many hours or more), especially if the CME’s starting direction/speed were uncertain. Thesee predictions are sensitive to observed coronagraph activity and can vary substantially if those observations are not clear and unambiguous (and they often aren't).