Screen H — Experimental 10-Day Solar Wind Model (Speed, Density, Pressure)
Summary
More detail
What this screen is
Think of this as a solar-wind forecast map. A computer model simulates how the solar wind spreads out from the Sun and flows past Earth. Colors show how the solar wind changes across space — faster/slower, thicker/thinner, and higher/lower pressure.
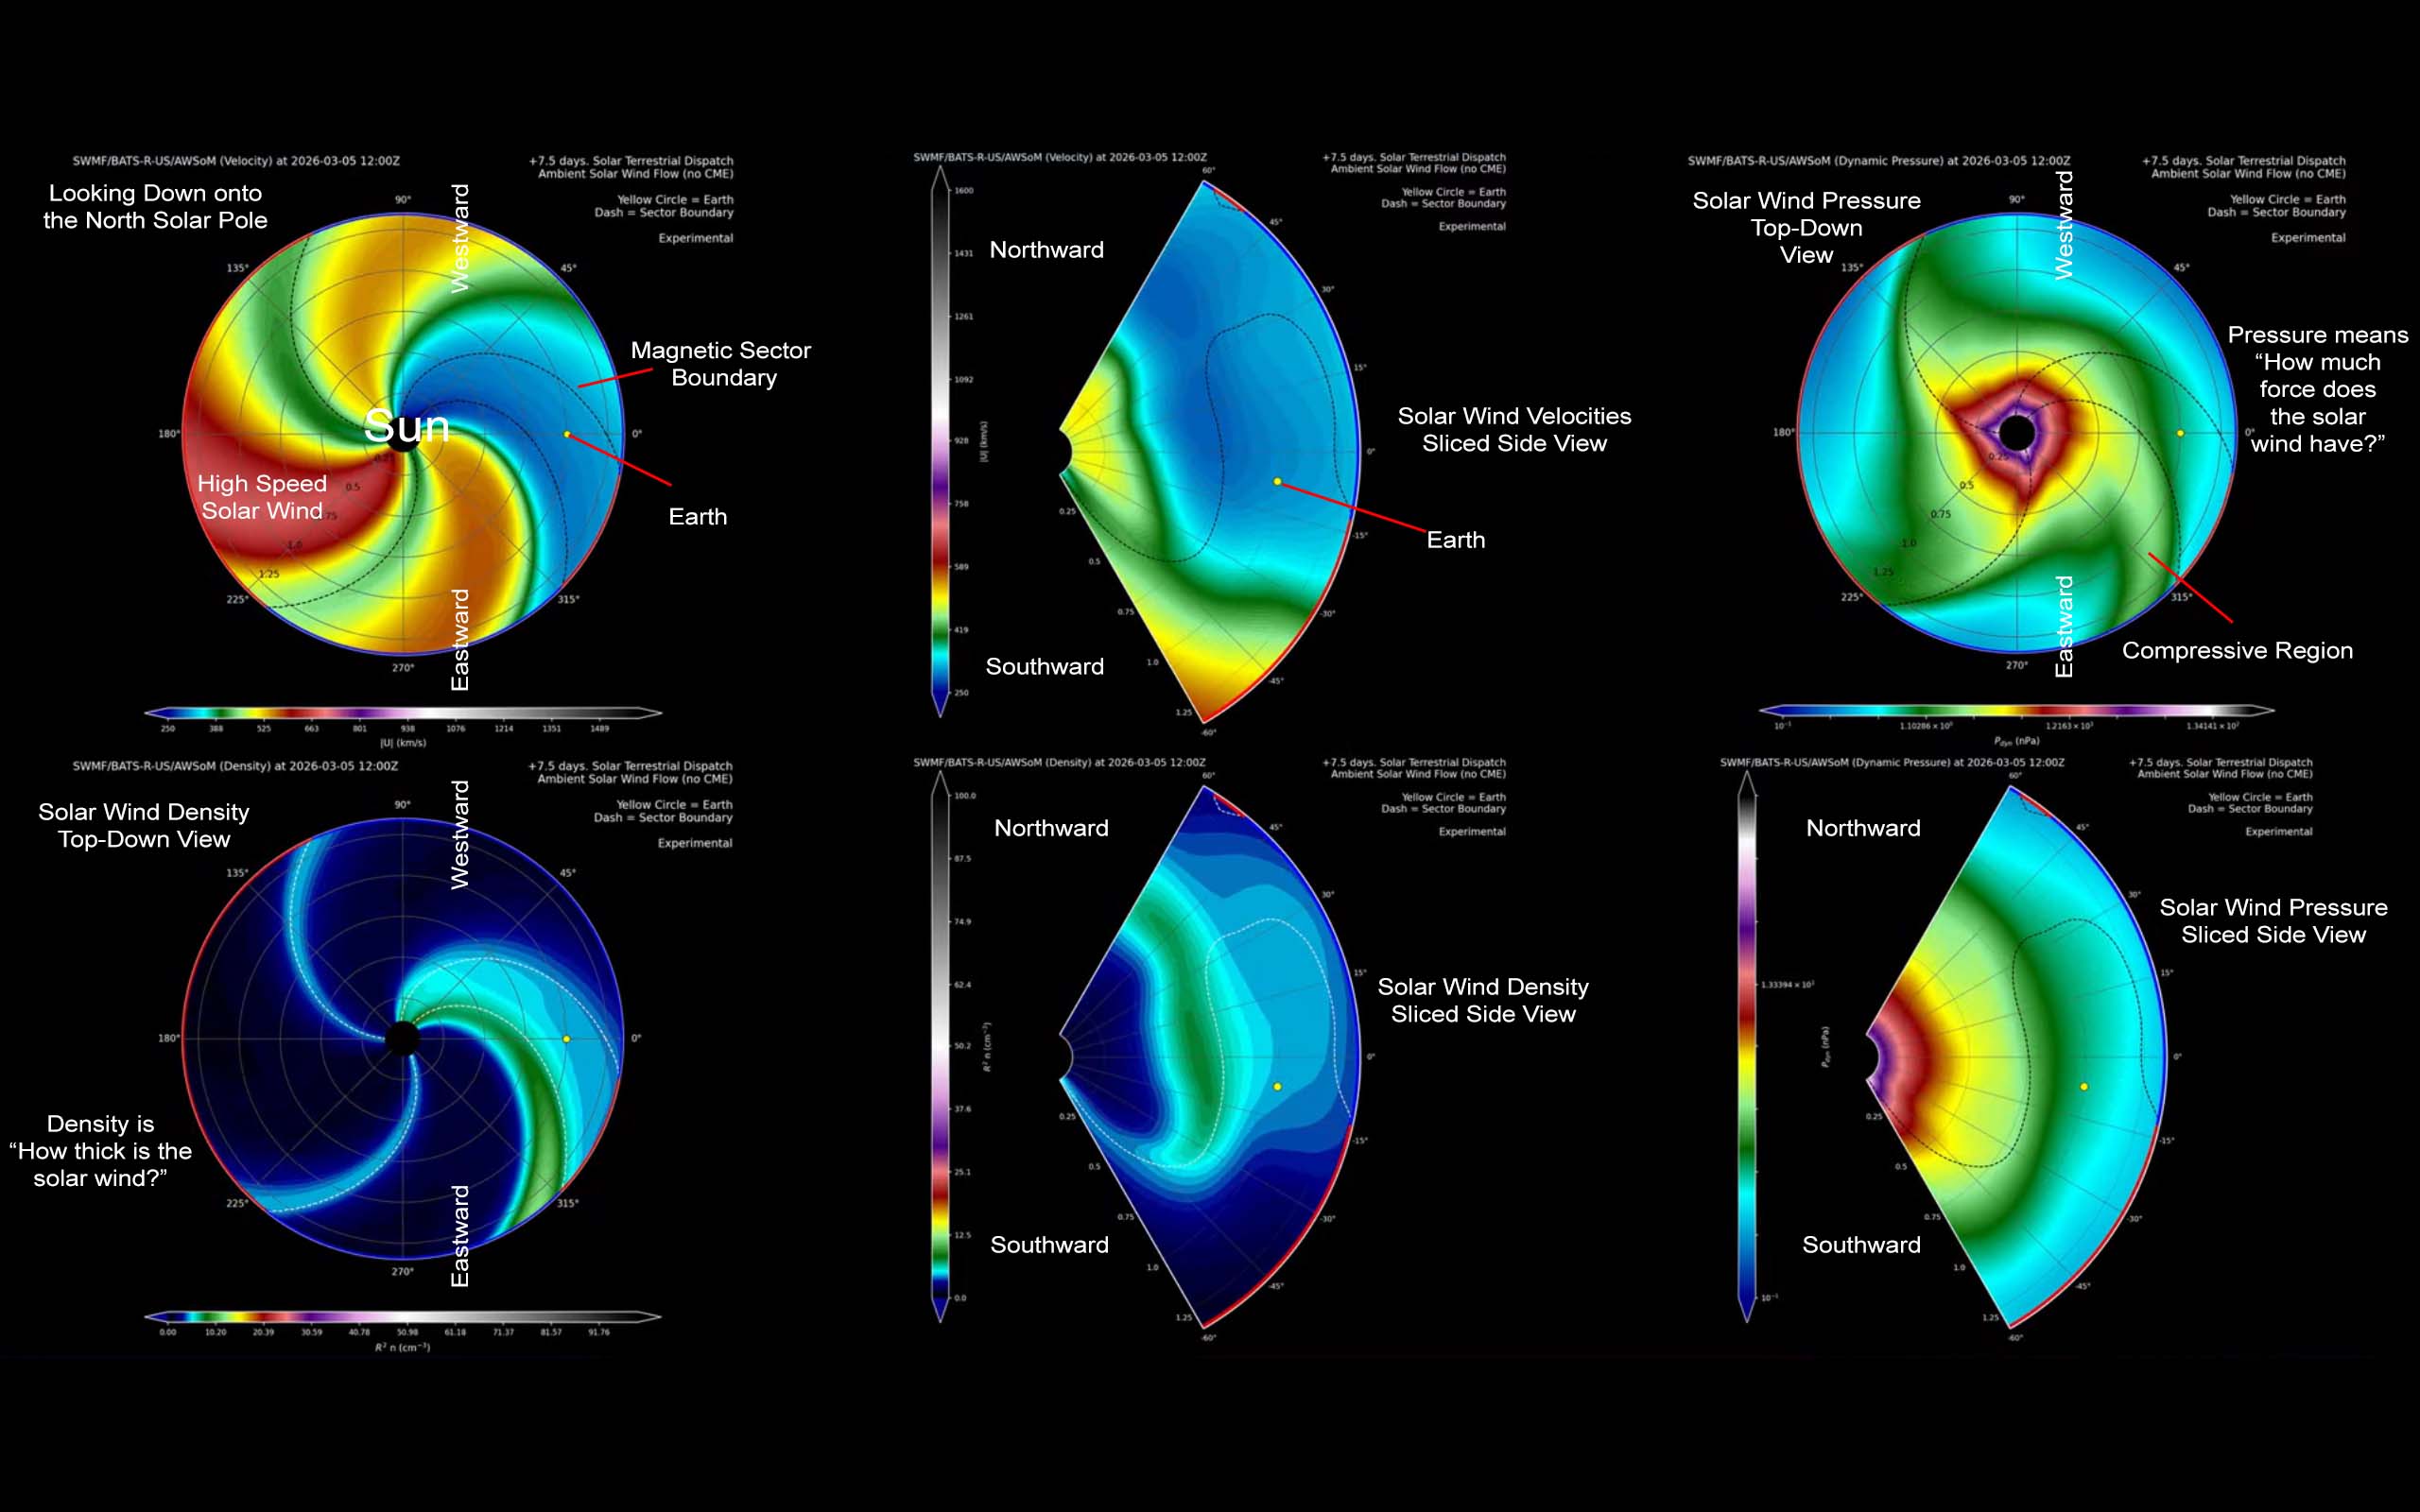
How the 6 panels are arranged
- Top-left: Solar wind speed viewed from above the Sun’s north pole, looking down at the plane where the planets orbit.
- Top-middle: Solar wind speed in a slice view that cuts through the Sun–Earth line. In this view, Earth’s yellow marker can drift slightly above or below the solar equator.
- Top-right: Solar wind pressure or temperature in the same top-down view. Temperature maps replace pressure maps when showing coronal mass ejections.
- Bottom-left: Solar wind density in the top-down view.
- Bottom-middle: Solar wind density in the slice view.
- Bottom-right: Solar wind pressure or temperature in the slice view. Temperature maps replace pressure maps when showing coronal mass ejections.
Extra markings you may notice
- Earth marker: Earth is shown as a yellow circle in every panel.
- Dashed lines: These mark magnetic sector boundaries — places where the large-scale solar magnetic field flips direction in space.
Where the images come from
- A large 3D physics model of the solar wind is run (SWMF / BATS-R-US / AWSoM).
- It uses magnetograms as an input. A magnetogram is a map of the Sun’s surface magnetic field — it shows where the magnetic field points outward versus inward on the solar surface.
- That magnetic map is used as a starting boundary condition so the model can simulate how the solar wind is guided and shaped as it expands into space.
- It is run as-needed and typically covers at least a 5-day time window.
How this differs from the WSA/ENLIL solar-wind images (and why it’s useful)
- WSA/ENLIL (prior screen): A widely used forecasting approach that estimates solar wind near the Sun using empirical relationships (WSA), then carries it outward through the solar system (ENLIL).
- SWMF / BATS-R-US / AWSoM (this screen): A more fully physics-based 3D simulation that models the solar wind as a magnetized flowing plasma, using magnetograms as part of the starting conditions.
- Bottom line: This is a complementary way to predict the solar wind environment. Comparing different models can help you judge confidence when they agree, and uncertainty when they disagree.
Artifacts: Simulations involving coronal mass ejections (CMEs) often show rings of enhanced solar wind encompassing the Sun. The color scheme we are using to illustrate the solar wind behavior highlights even the smallest changes, which amplifies their visibility. Most of the rings that propagate far from the area of the CME's trajectory would not be observed in reality. But the physics of their propagation is being properly manifested. And some powerful coronal mass ejections really do produce global waves that can be observed even from the opposite side of the Sun. But be aware that this is largely untrue for most CMEs, which are dampened away from the CME's primary trajectory more strongly than this simulation predicts.
Also, unlike the semi-empirical WSA/ENLIL models used by NASA which do not embed magnetic flux-ropes, this model does. Every CME simulation includes an embedded magnetic flux-rope whose orientation is derived from synoptic magnetograms based on scientific studies. CME's containing flux-ropes can propagate a little differently than models that exclude them. Slower moving eruptive filaments (prominences) are handled differently than explosive CMEs sometimes associated with strong solar flares. Filament eruptions are simulated through the erosion of strapping magnetic fields (above the erupting flux rope) that typically hold them in place. When those strapping fields weaken sufficiently, the flux rope naturally becomes a CME. This model handles these situations, but is still subject to many possible inaccuracies.
There are also significant gaps in our observations of the solar wind, particularly close to the Sun, that can't be directly imagined into a simulation. So caution is advised while viewing these beautiful simulations. They don't always represent reality.
Longer simulation tuning sessions are regularly run to attempt to keep the accuracy of the model outputs optimized. But no simulation of something so complex can be perfectly tuned.
Important limitations: These are experimental products, meant more to help the public understand the complexities of solar wind interactions and to help guide forecasters who have an understanding of the limitations of the simulations. Solar Terrestrial Dispatch does not guarantee the accuracy of any of the results.