Screen A — Ground Magnetometers (U.S. and Canadian Magnetic Observatory Data, last 12 hours)
Summary
This is ‘ground truth’ for geomagnetic disturbance. If the solar wind is stirring Earth’s magnetic field, you’ll often see it here as wiggles and rapid changes. These rapid changes are especially relevant to induced currents and some infrastructure concerns.
More detail
What you’re looking at
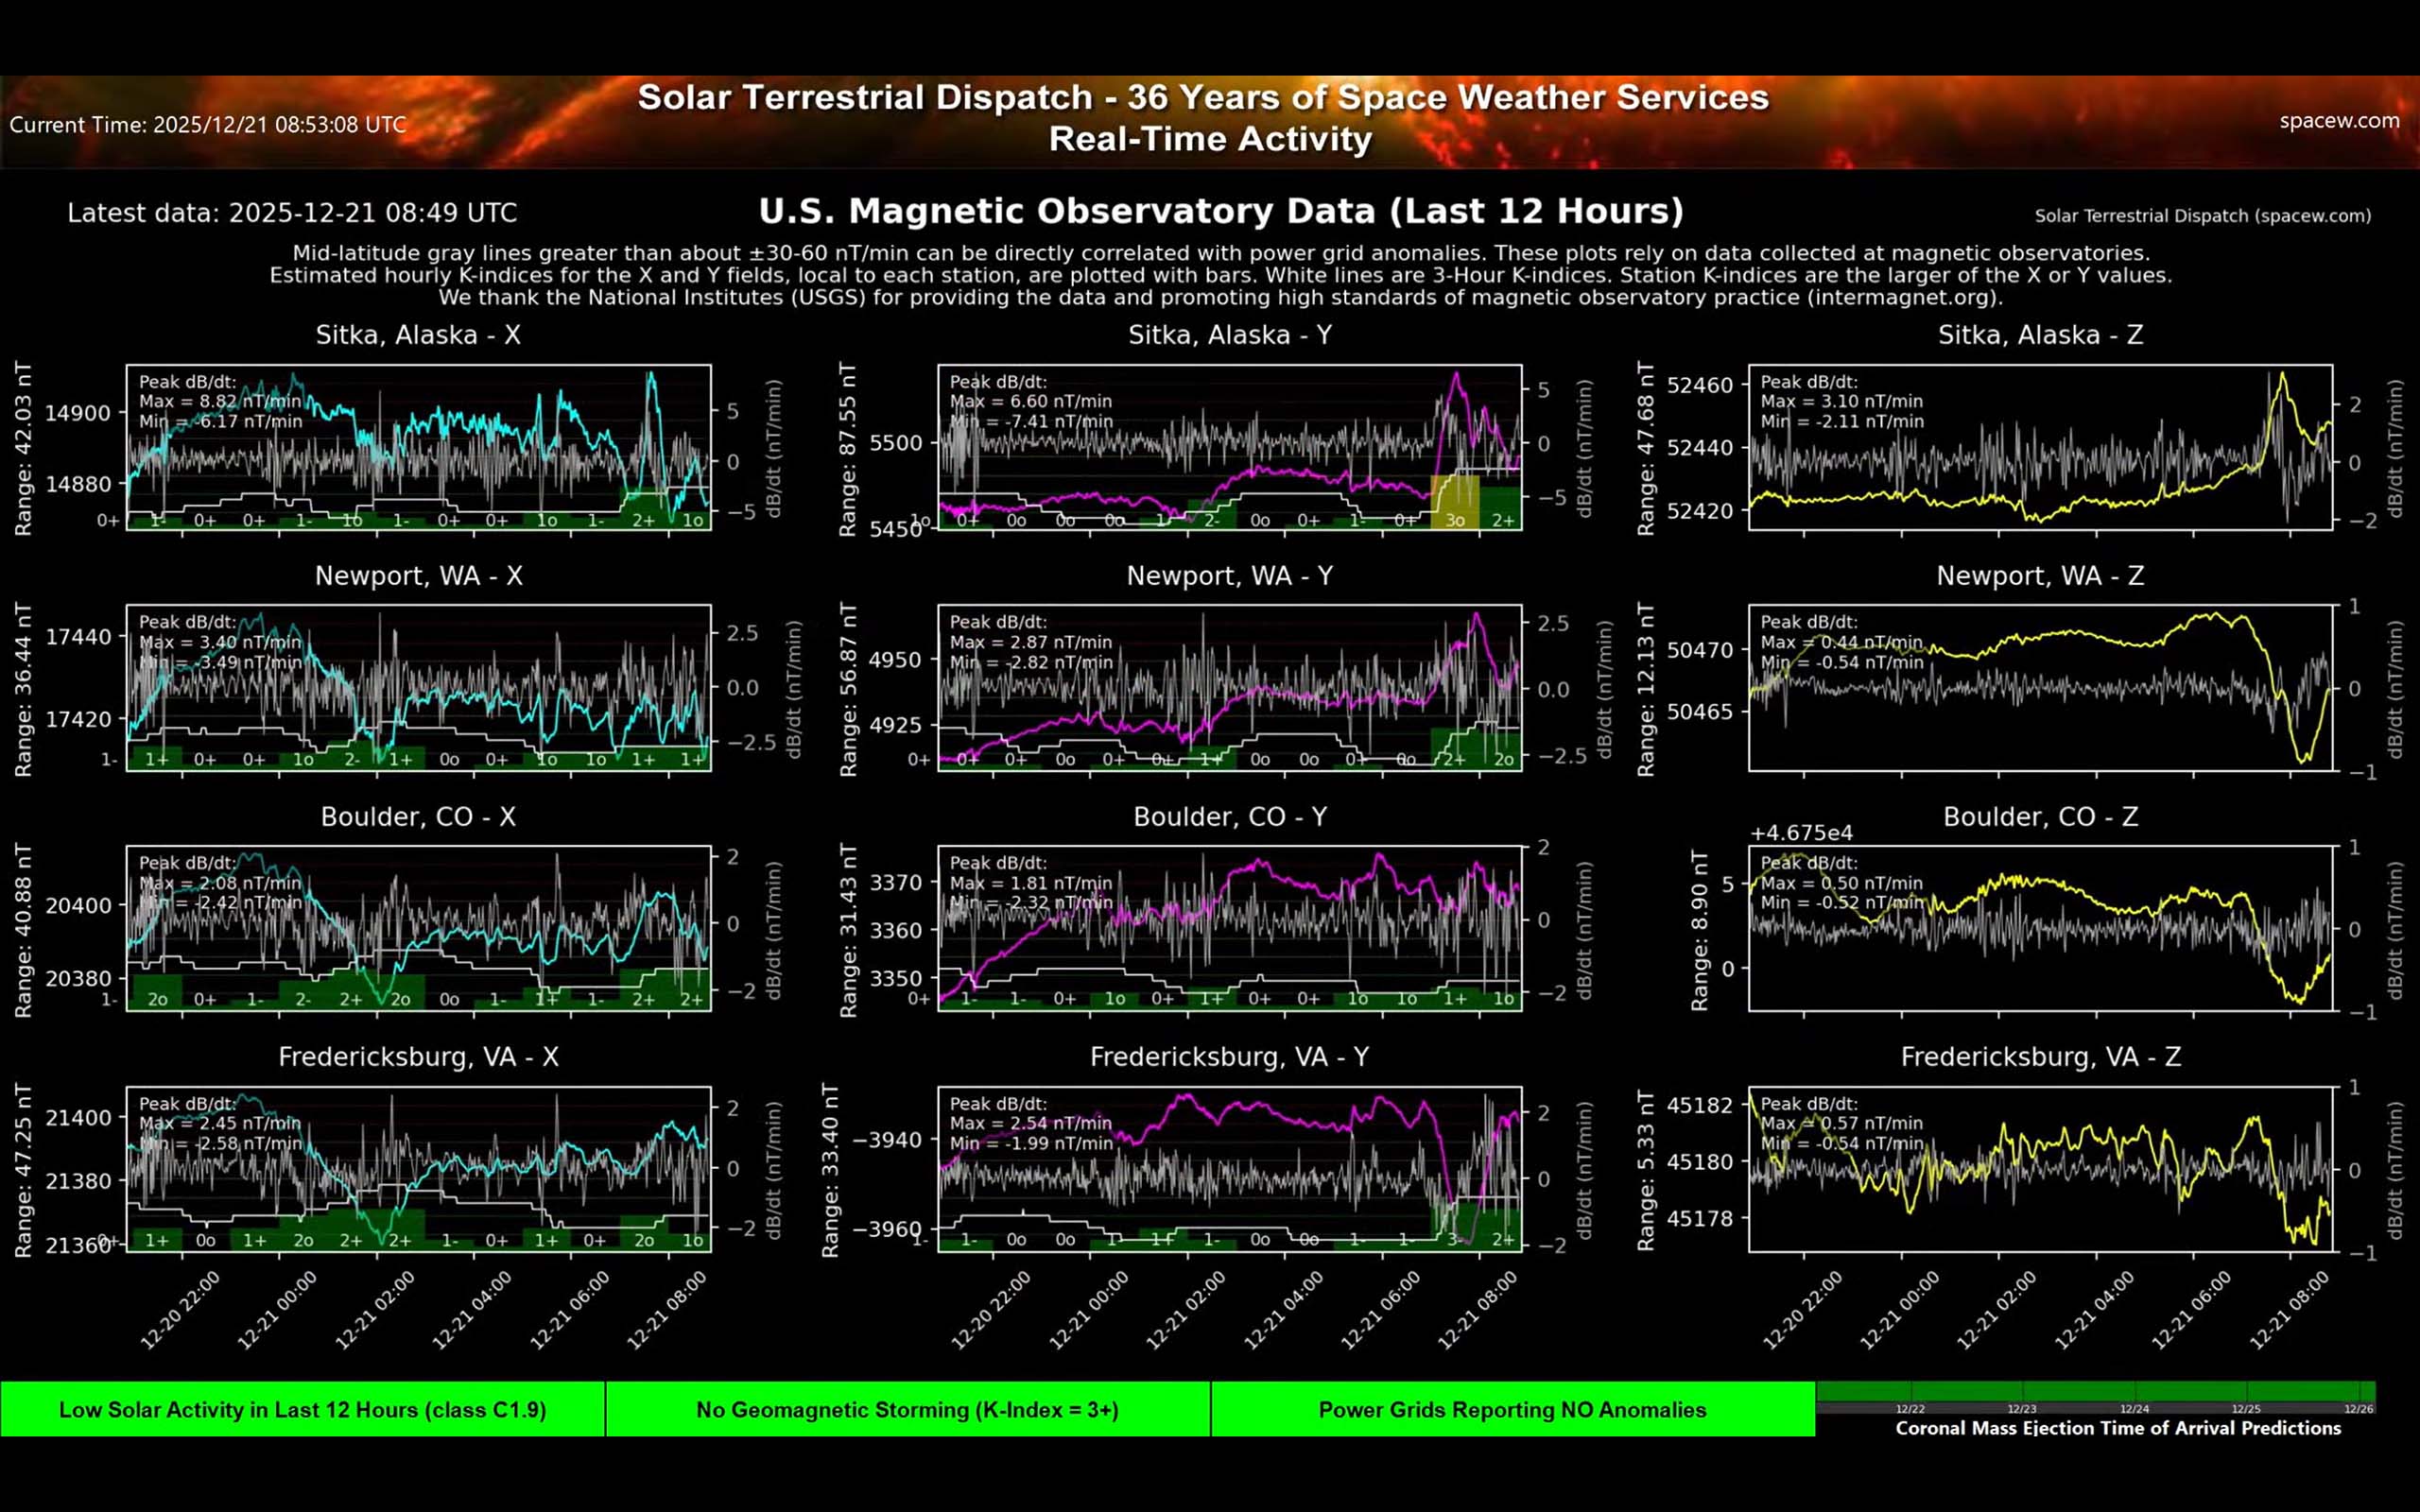
- Multiple observatories spanning from the U.S. to Canada, each showing components X, Y, Z of the magnetic field.
- Many plots include dB/dt (rate of change). This is a measure of how fast the field is changing.
- The X and Y plots include local station K-index calculations. The local K-index varies from zero (very quiet) to 9 (extremely disturbed). The hourly K-index is shown as a bar and the current hourly K-index (0, 1-, 1o, 1+, 2-, 2o, 2+, etc) is displayed at the base of that bar. The running 3-hour K-index is shown as a solid white line. If you look close, each plot has a dotted grid that shows the K-index levels to help you determine the levels of the white line. Fluctuations of the magnetic field are in units of nano-Tesla's and the Range indicates how much the magnetic field component has changed during the last 12 hours. The station K-index is the higher of either the X or Y components. So for example, if the X-component K-index is 2- (equal to 1.667) and the Y-component is 3o (equal precisely to 3.0), the station K-index for that time period would be the higher 3.0 (3o) value.
How to interpret it
- Bigger wiggles usually mean stronger geomagnetic activity. There is a daily variation (even during quiet times) that these plots don't correct for. You can see the daily variation as slow-moving ups and downs.
- Faster wiggles (dB/dt) mean rapid change. Changes that produce dB/dt values of more than about 30 nT/minute can be associated with induced ground currents in some regions (depending on ground conductivity).
- Compare stations: widespread disturbances across stations usually indicate a broader or global event.
Practical tip: If Bz is southward and the auroral oval expands, magnetometers can be used to confirm the response. They help answer: “Is Earth actually reacting right now?” Fluctuations are strongest in the auroral zone.