Screen 6 — Multi-Wavelength Sun + Magnetic Context (full disk + zooms)
Summary
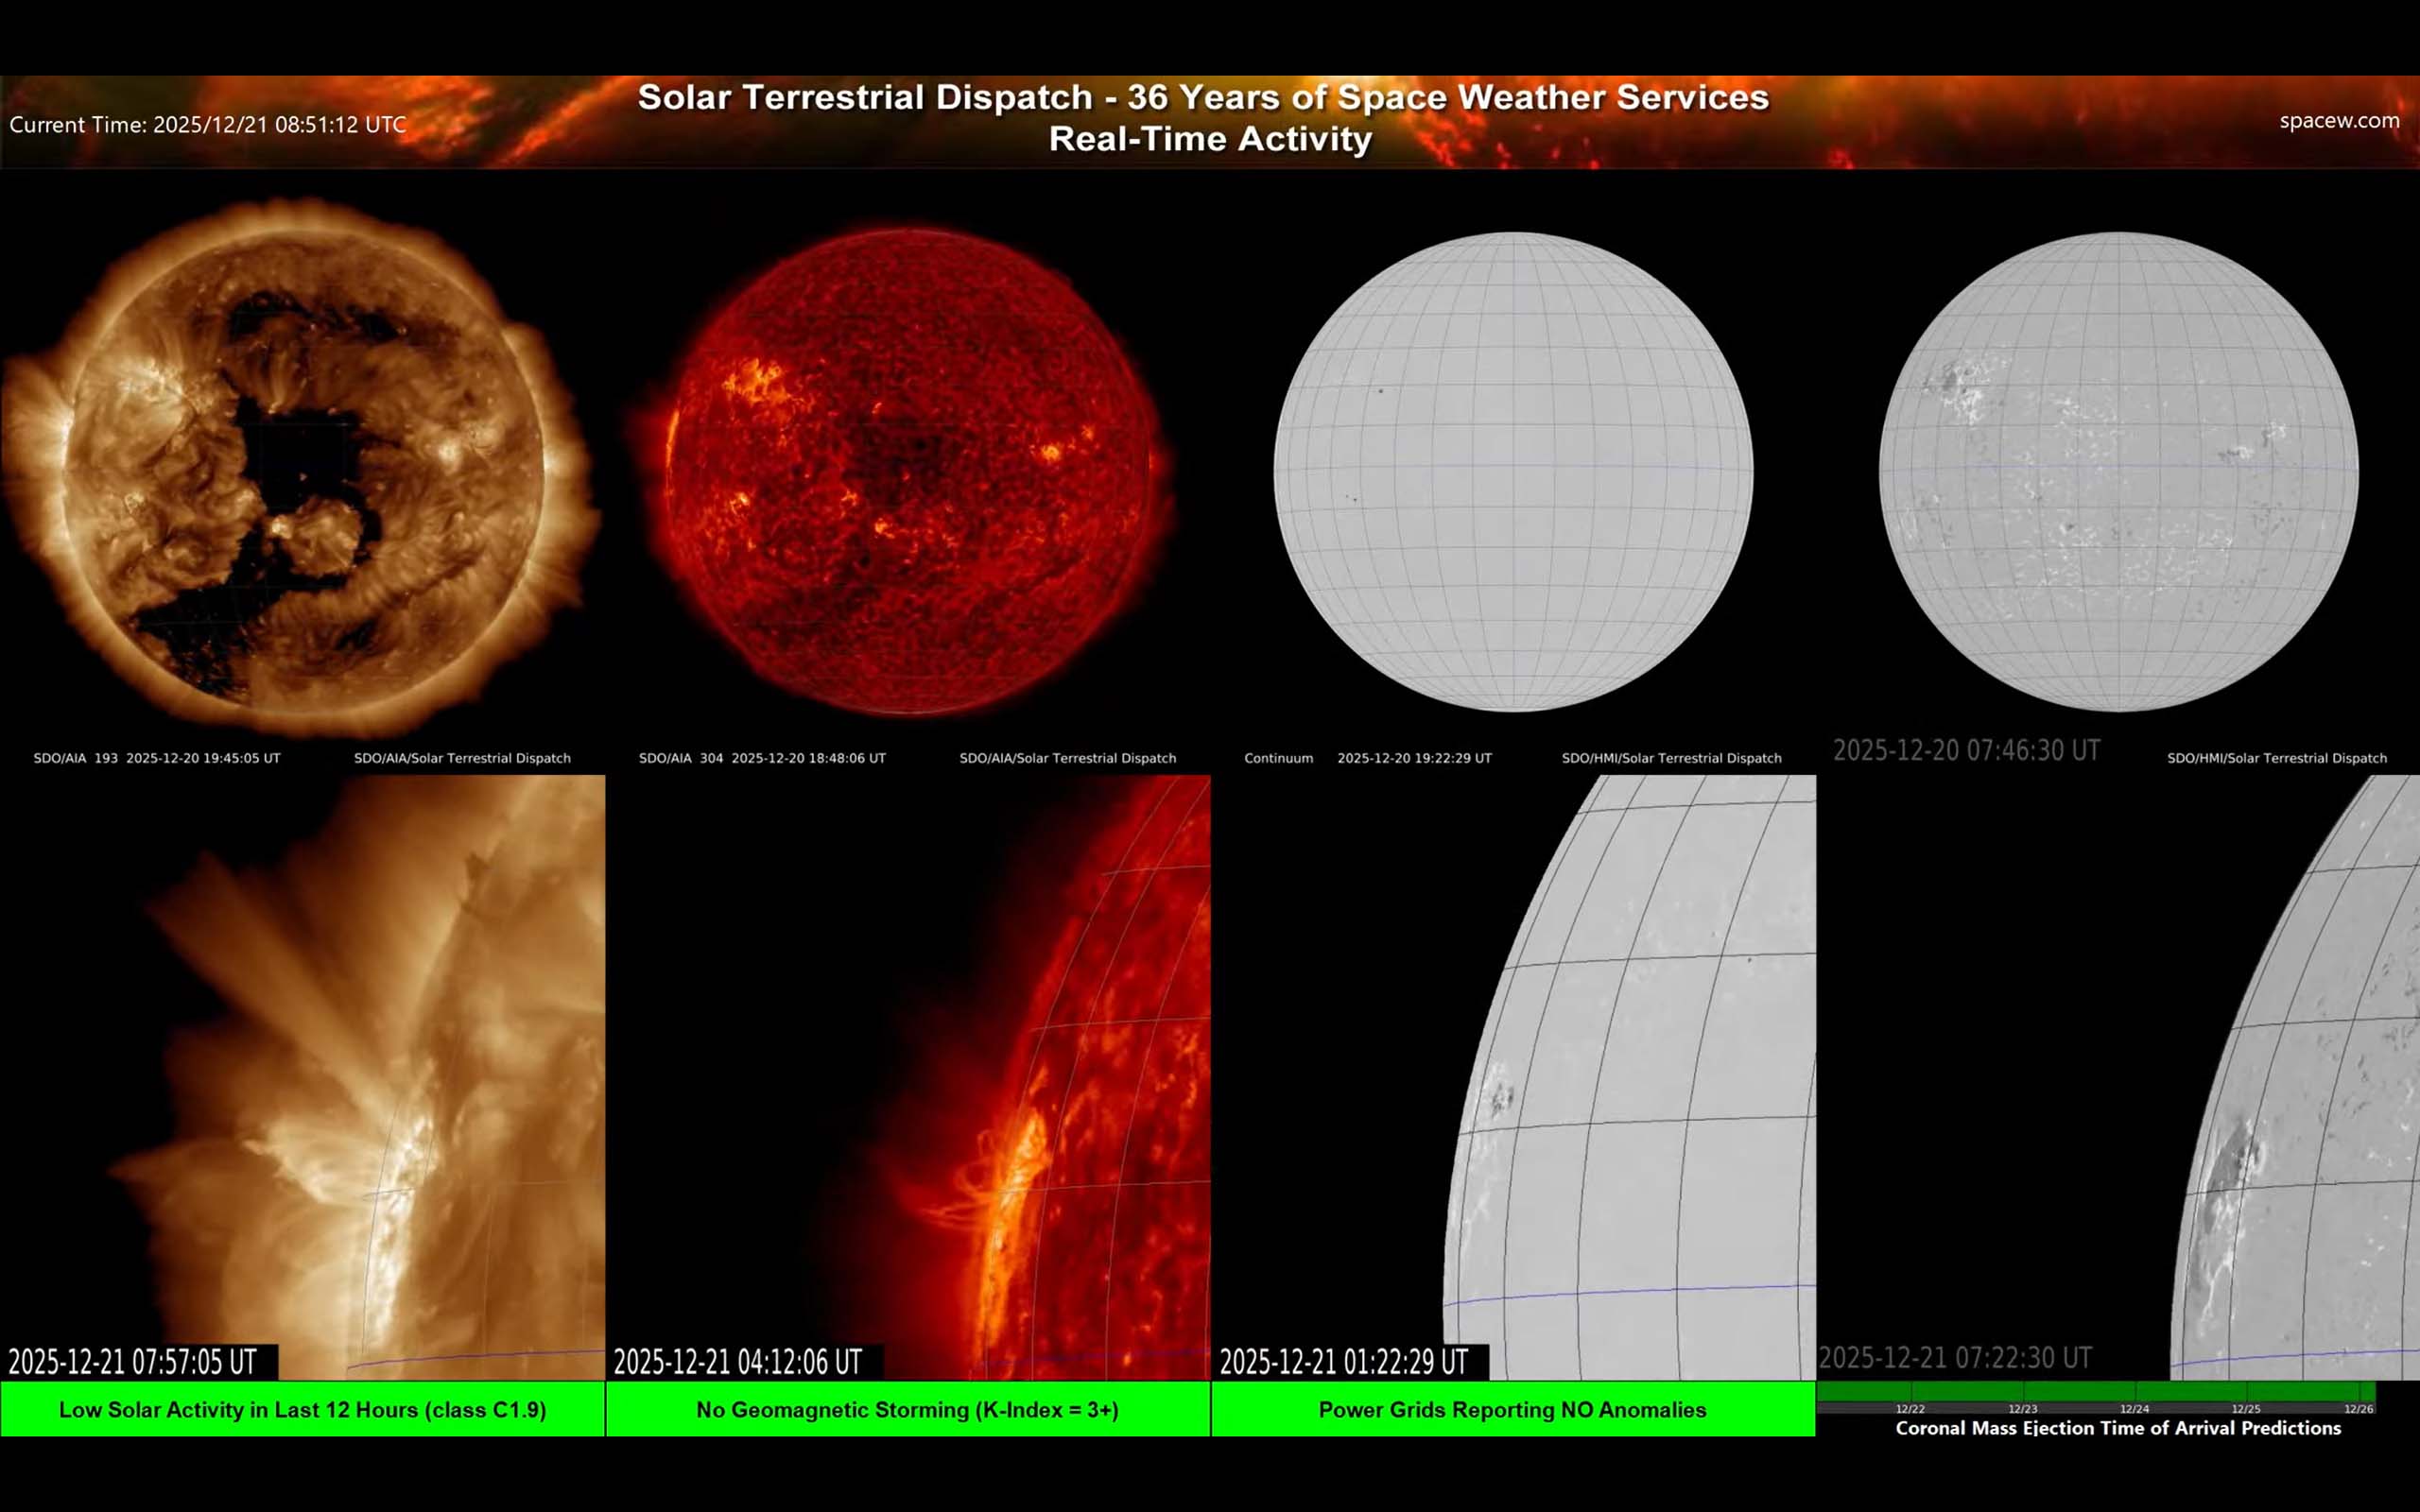
This screen is about context: different wavelengths show different layers of the Sun, and the magnetogram/continuum show where magnetic complexity and sunspots are located. It’s especially useful for learning how sunspots and magnetic structure relate to bright coronal loops and eruptions. All images in this screen are from the Solar Dynamics Observatory.
More detail
What the panels mean
- AIA 193/195Å (gold): Hot corona — magnetic loops and coronal holes.
- AIA 304Å (red): Cooler upper-atmosphere material — good for prominences/filaments and flare ribbons.
- Continuum (white-light surface): Shows sunspots (dark) and the visible surface structure.
- HMI magnetogram: A map of magnetic “push/pull” regions on the surface, superimposed on the visible white-light images. Complex areas tend to be flare-capable.
How to use it
- Find sunspots in continuum and match them to magnetic complexity in the magnetogram.
- Then look at EUV to see how the corona above those regions is structured (bright loops, bright cores, etc.).
- Use the zooms to watch how activity evolves near the limb or within a target region.
Practical tip: When you’re learning, this is a great way to relate what you see (sunspots) to what matters (magnetic structure).